
Case study — Investor Acquisition services
Why experience outperforms the market
With over 30 years of experience backed by Independent research, data-driven analysis, and long-standing relationships — not developer loyalty — is how we find the opportunities that matter.
The challenge
Most investors are sold a story. We find the data and then using our industry relationships source off market opportunities for our clients to outperform the market.
The property market is full of noise — developers with polished brochures, property spruikers with vested interests, and platforms that surface the same opportunities to everyone. The investors who consistently outperform aren't the ones with the biggest budgets. They're the ones with better information and better counsel.
At Slava360, we don't align ourselves with a specific developer or builder. We have no preferred panel, no offer of bulk discounts and no incentive to push one project over another. Our only obligation is to the investor sitting across the table from us and to let our results speak for themselves.
Section 01 — The National Picture
Understanding the cycle before picking the market
It's important to look at short term market trends, National dwelling values have grown consistently since 2019, with the exception of the 2022 correction following rapid rate rises. The cycle has since recovered strongly — posting +8.1% in 2023, +4.9% in 2024, and +8.6% in 2025. Understanding where we are in the cycle is the foundation of every investment decision we make.
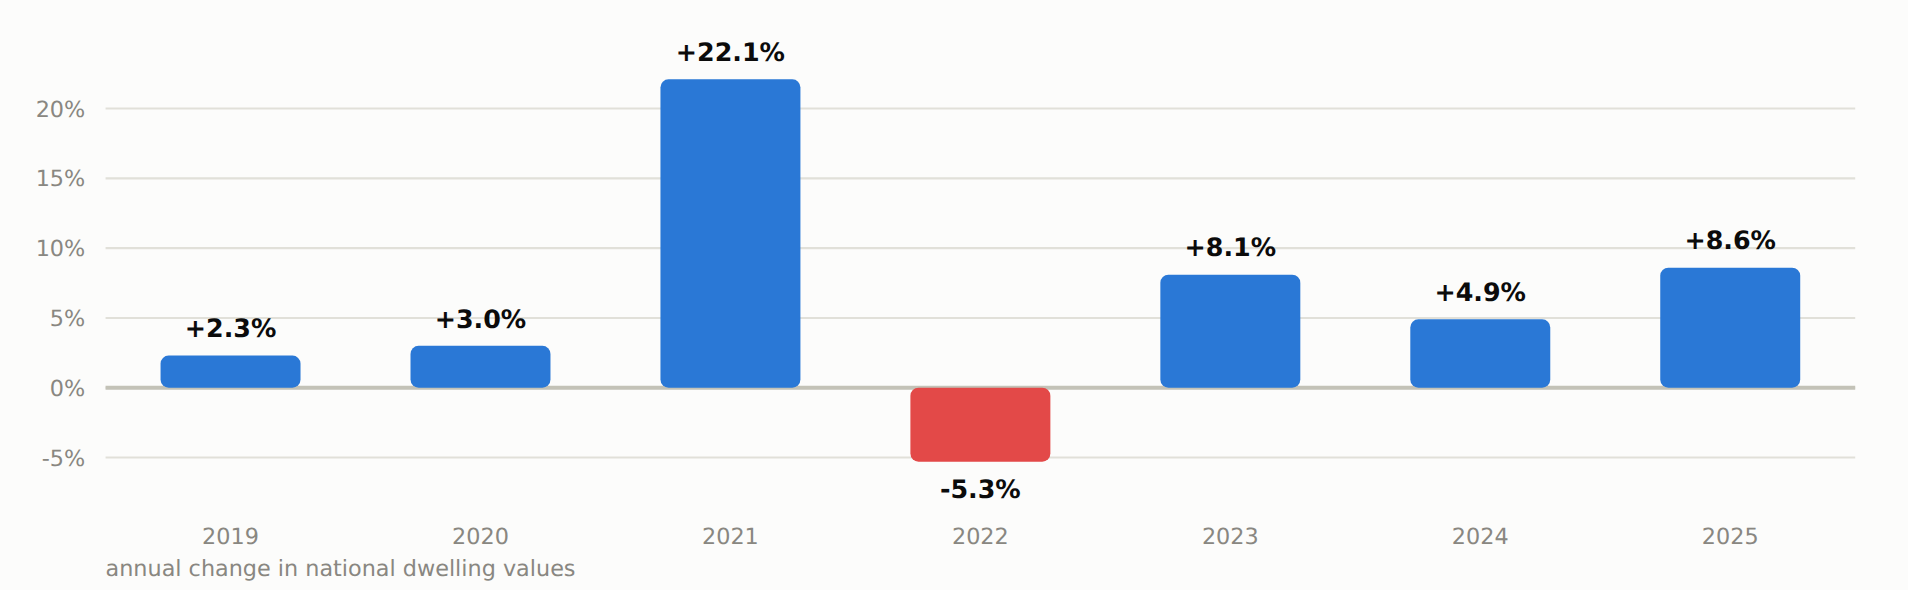
Annual change in national dwelling values, 2019–2025
The 2022 correction was short-lived and rate-driven. Markets that held through it — particularly Perth, Adelaide, and Brisbane — have since delivered the strongest cumulative returns in the country.
Section 02 — Market Selection
Not all markets are equal — and getting in too late could mean missing out on tens of thousands in potential equity growth in the short term.
Cumulative growth from December 2020 to December 2025 ranged from −0.6% (Regional NT) to +89.0% (Perth) — a spread of nearly 90 percentage points. Investors who chose the right market didn't just outperform; they achieved nearly double the national average of 46.8%. This is why market selection is the single most important decision in a property investment strategy.
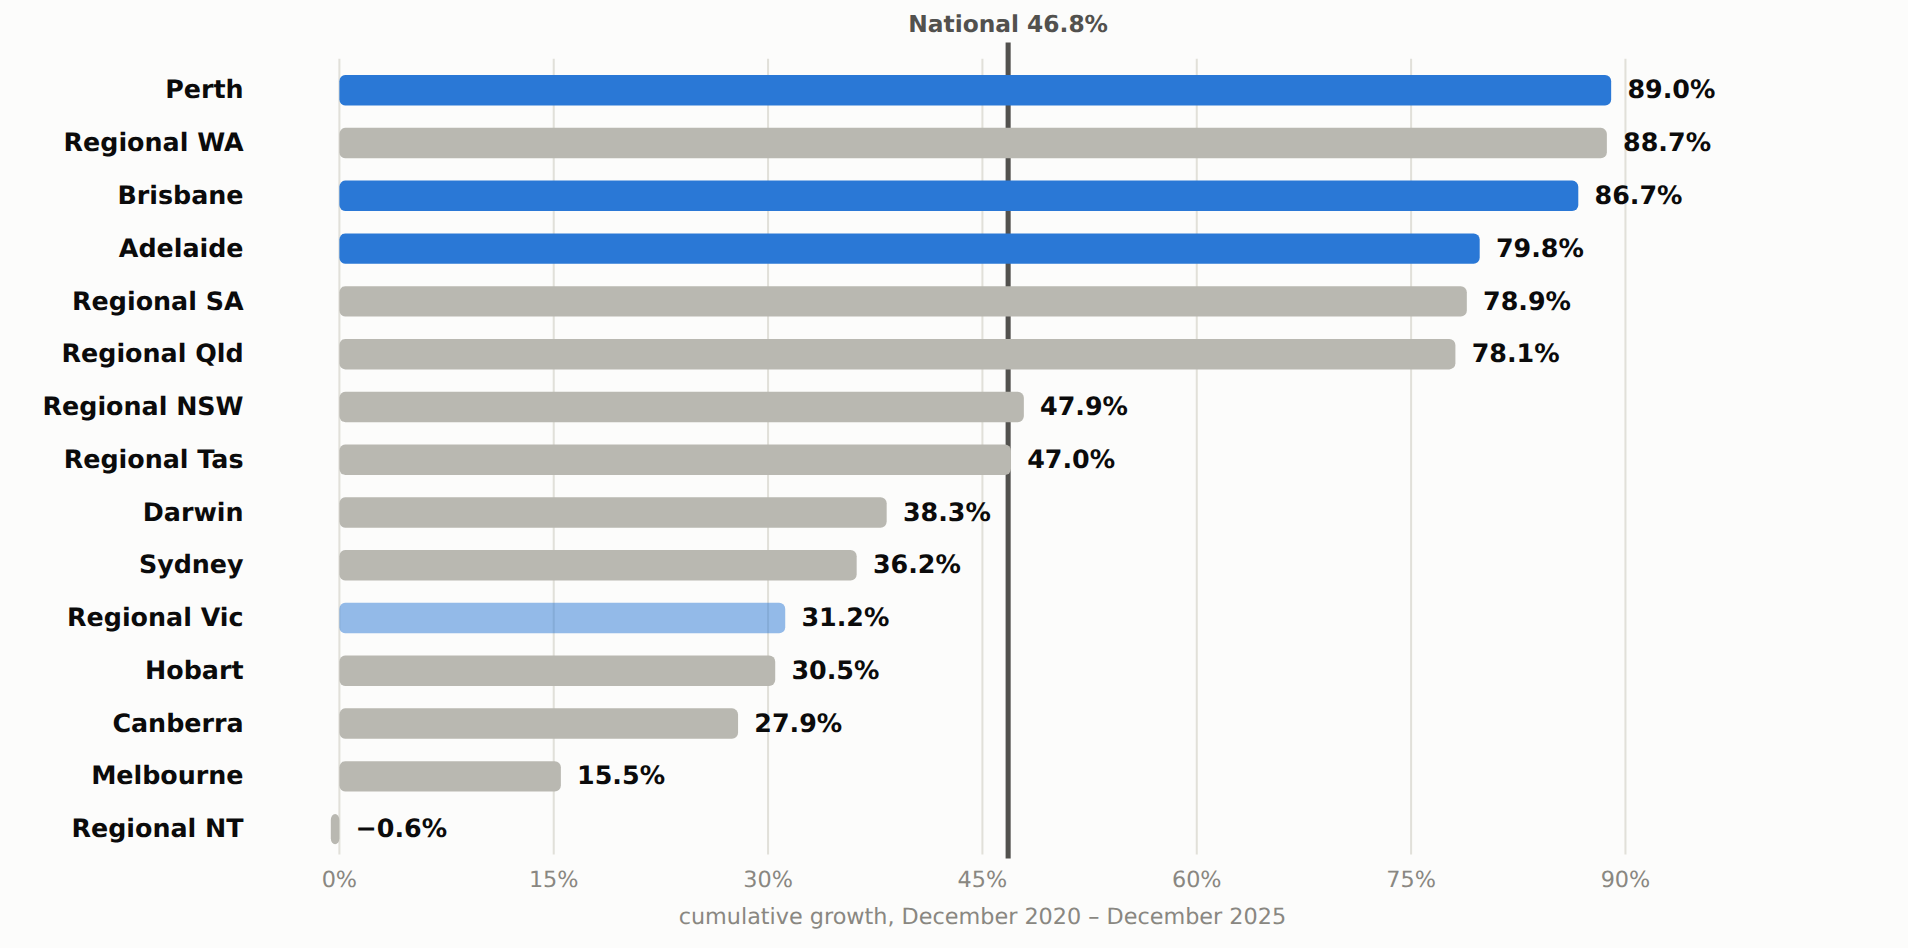
Cumulative growth by market, December 2020 – December 2025
Perth (89.0%), Regional WA (88.7%), Brisbane (86.7%), and Adelaide (79.8%) all delivered growth nearly double the national average of 46.8%. Melbourne (15.5%) and Regional NT (−0.6%) demonstrate the cost of choosing the wrong market.
Section 03 — Timing the Entry
The right market at the right time
The opportunity isn't limited to capital cities. Perth delivered 59.0% growth in just three years (Dec 2022–Dec 2025) — 2.55× the national rate over the same period. Adelaide's five-year run produced 79.8% — 1.71× national. Brisbane's earlier cycle (Dec 2019–Dec 2023) delivered 47.6% — 1.66× national. Identifying which city is at the start of its run, not the end, is where experience creates the most value.
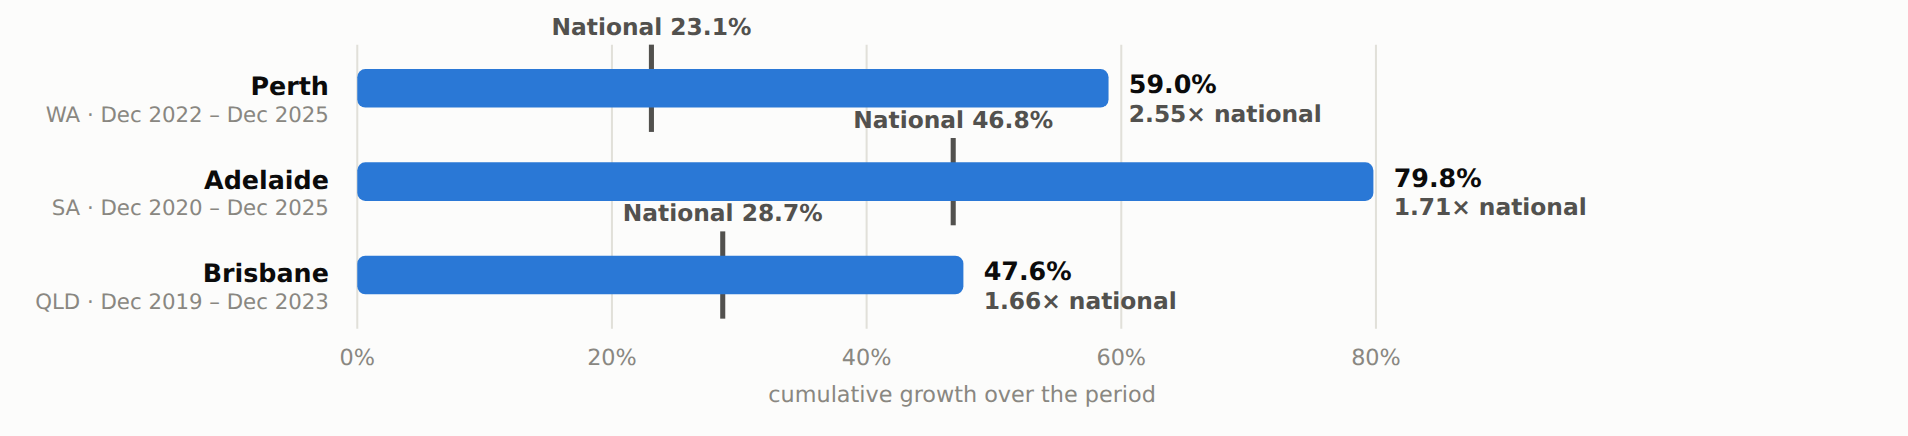
Selected capital cities vs national benchmark — cumulative growth over respective periods
Perth at 2.55× national, Adelaide at 1.71×, Brisbane at 1.66×. Each city's outperformance window was distinct — identifying the entry point before the run is the critical skill.
Section 04 — Suburb-Level Analysis
Within the right market, suburb selection multiplies the return
Choosing the right state is necessary but not sufficient. Within Adelaide, suburbs like Andrews Farm (131.3%) and Munno Para West (125.9%) delivered more than 2.5× the national average — while the city-wide index sat at 79.8%. In Perth, Wellard (21.5%) and Mandurah (19.3%) outpaced the broader Perth market (16.3%) in the 12 months to July 2026. The data shows that suburb selection within an outperforming market is where the real alpha is generated.
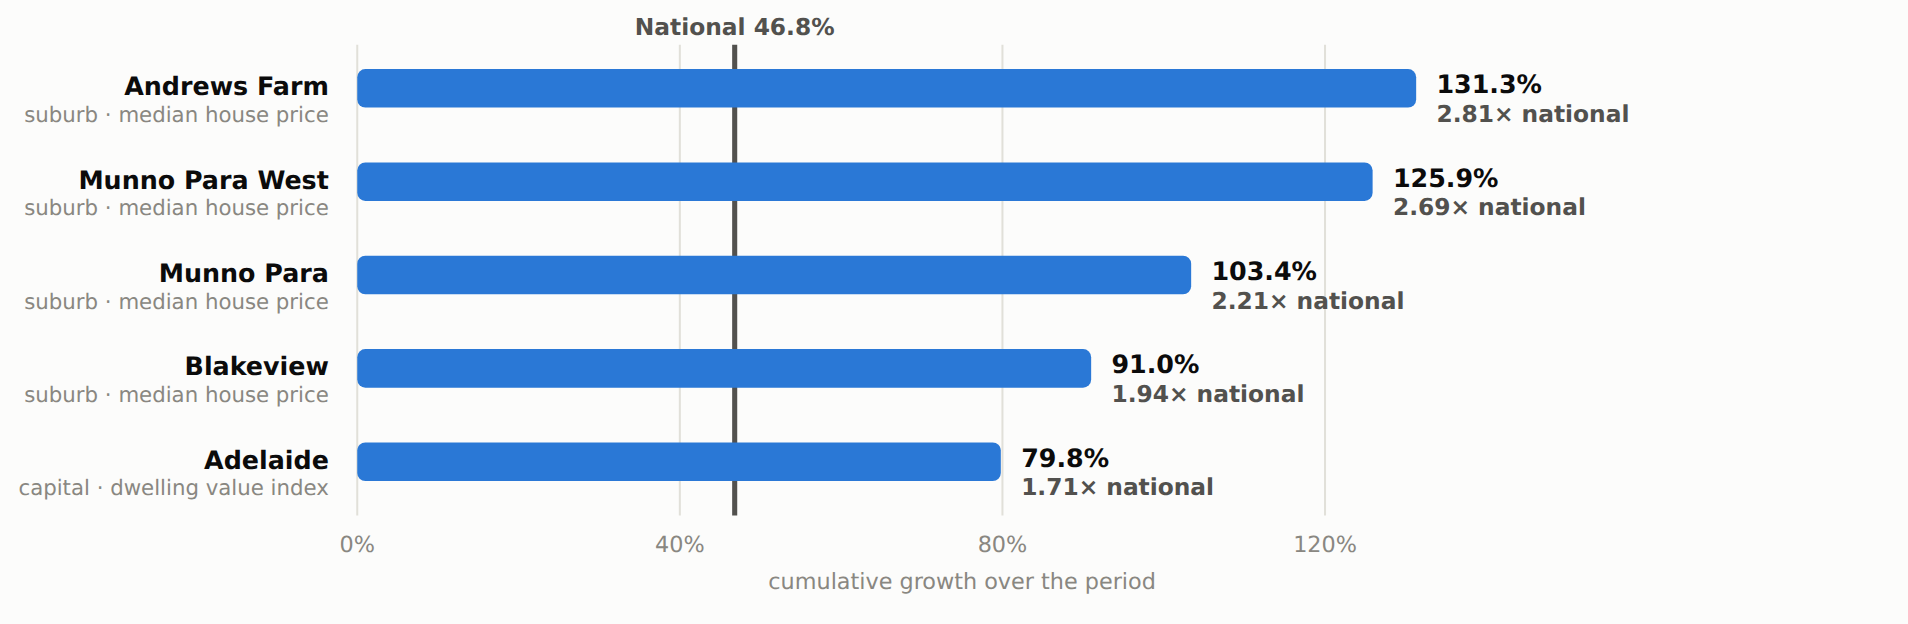
South Australia — suburb vs capital performance, Dec 2020–Dec 2025
Andrews Farm (131.3%), Munno Para West (125.9%), and Munno Para (103.4%) all exceeded 2× the national average — while Adelaide's city-wide index of 79.8% was itself 1.71× national.
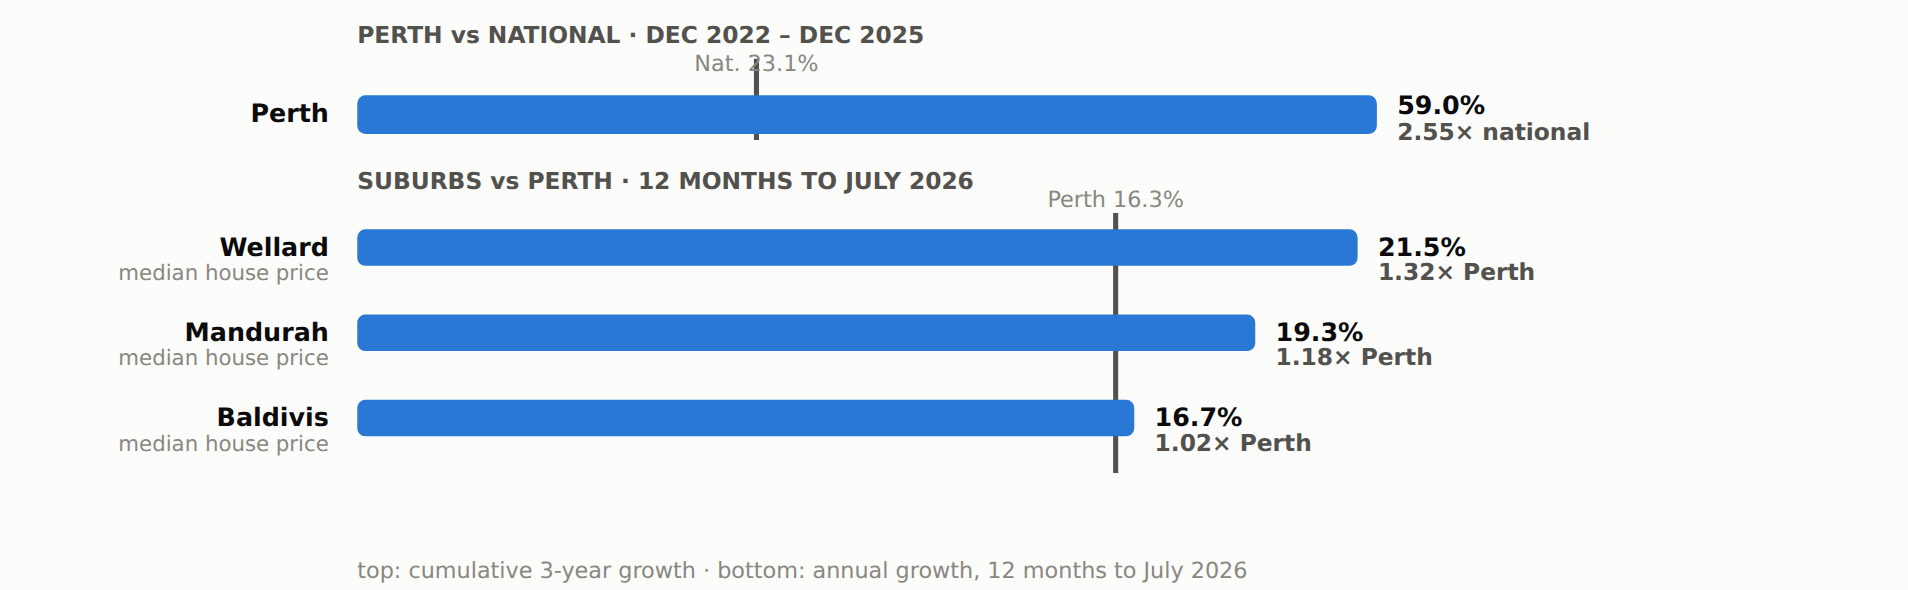
Western Australia — Perth vs national (3-year) and suburb leaders (12 months to July 2026)
Perth delivered 59.0% over three years (2.55× national). At the suburb level, Wellard (21.5%) and Mandurah (19.3%) continued to outpace the broader Perth market in the most recent 12-month period.
Section 05 — Beyond the Capitals
Regional markets and emerging corridors
The opportunity isn't limited to capital cities. Queensland's growth corridors — Pimpama (105.3%), Walloon (103.6%), Toowoomba (99.6%), and Ipswich (97.0%) — all exceeded Brisbane's city-wide figure of 47.6% by a significant margin. Regional Victoria, while more modest, still outpaced the national average in both 2020 and the 12 months to March 2021 — demonstrating that regional markets can offer compelling risk-adjusted returns when the fundamentals are right.
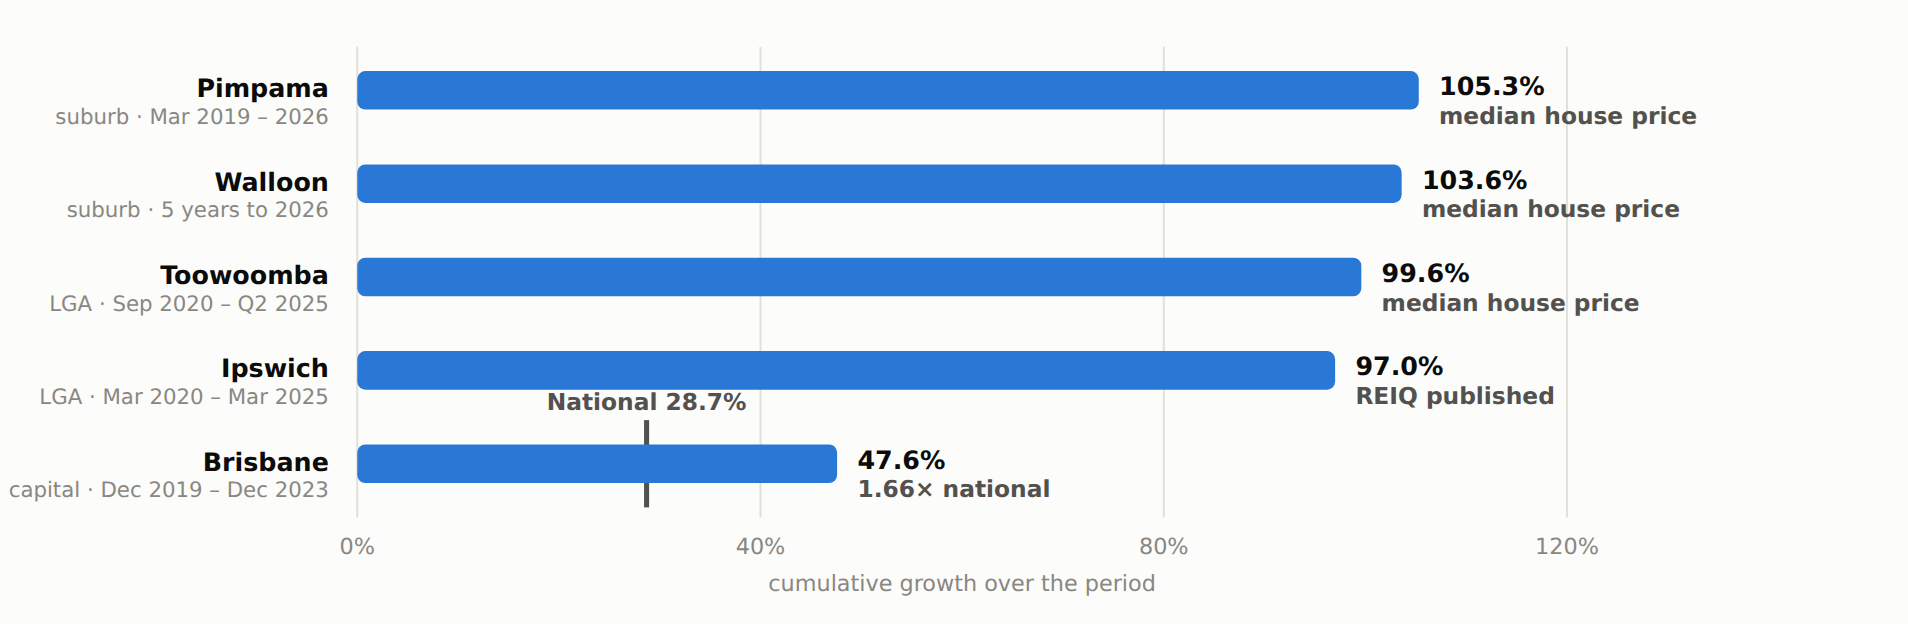
Queensland — suburb and LGA leaders vs Brisbane capital and national benchmark
Pimpama (105.3%), Walloon (103.6%), Toowoomba (99.6%), and Ipswich (97.0%) all more than doubled Brisbane's city-wide growth of 47.6% — illustrating the value of looking beyond the capital city index.
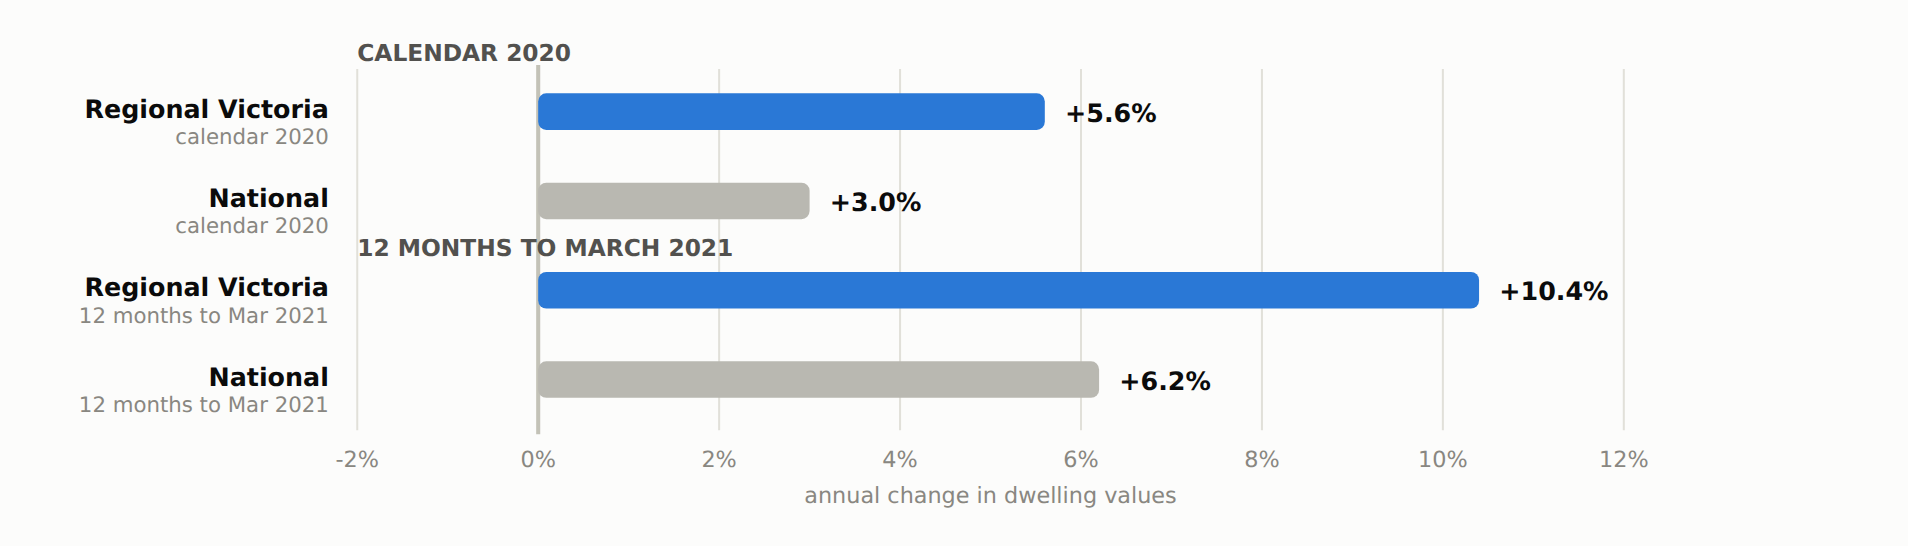
Regional Victoria vs national — calendar 2020 and 12 months to March 2021
Regional Victoria (+5.6% in 2020, +10.4% in the 12 months to March 2021) consistently outpaced the national average in both periods — a reminder that regional fundamentals can outperform when population and lifestyle drivers align.
The Slava360 difference
"We don't align ourselves with a specific developer or builder. We research and break down every state and suburb to find opportunities positioned to outperform — in both the short and long term."
Slava360 Investor Advocacy
What this means for you
Better decisions. Better outcomes.
Independent advice
No developer affiliations. No referral fees. Counsel that sits entirely on your side of the table.
Proprietary research
Access to analysis that goes beyond what's publicly available — built from data, relationships, and decades of market experience.
Short and long-term strategy
Opportunities assessed across both time horizons so your portfolio is built for yield today and growth tomorrow.
End-to-end advocacy
From opportunity identification through to settlement, we stay engaged — not just at the point of recommendation.
Full report
Market Overview — Complete Analysis
Download the full data report covering all states, suburbs, and market cycles.
Ready to invest with better information?
Let's talk about your investment goals and where we can find the right opportunities for your portfolio.
Start a Conversation